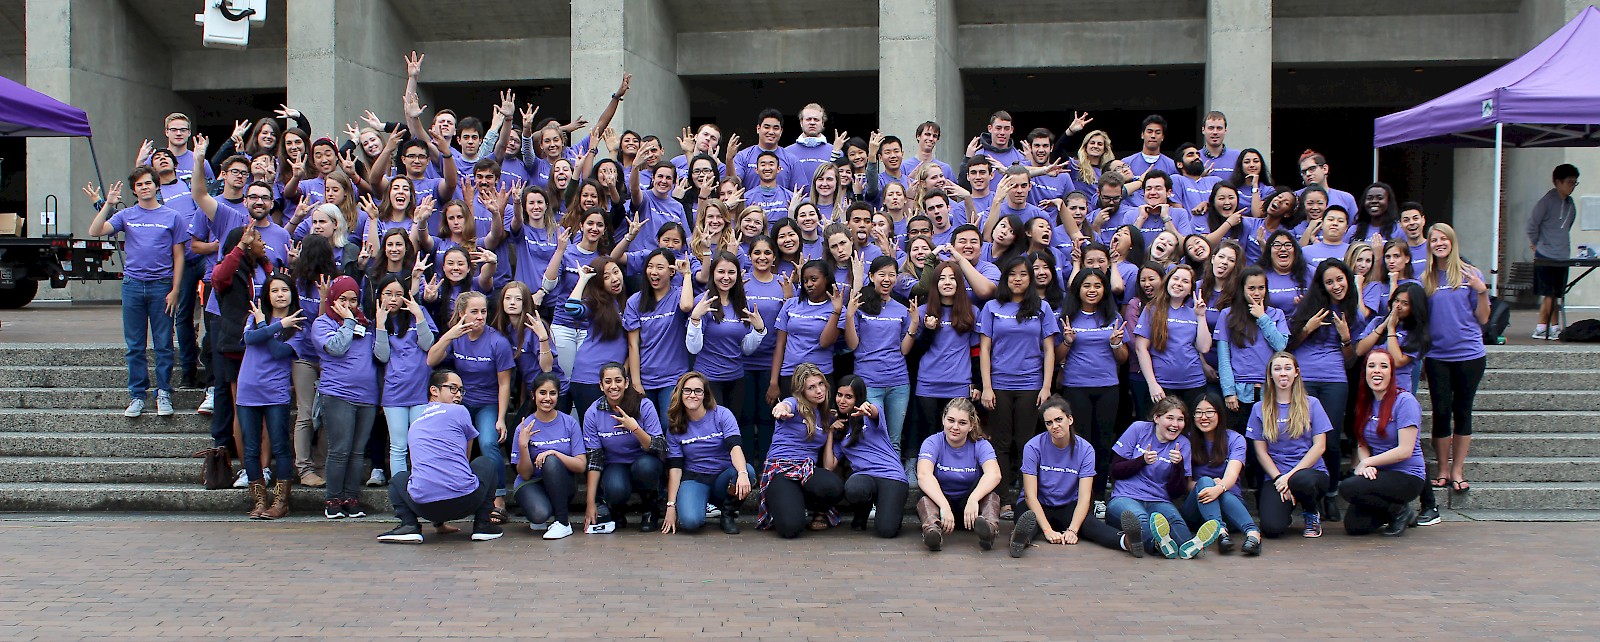
Making friends. Building academic community. Finding mentors.
The FIG program began in 1987 as a means of creating small, intentional learning communities within the large university setting. Since their inception 30 years ago, FIGs have linked clusters of courses to seminars facilitated by peer instructors. The number of FIGs increased steadily from 1987, when 4 clusters were offered, to today with over 150 clusters offered. As we study the effects of the FIG program on student persistence and retention rates, we can report that FIG students return for their second year and graduate at higher rates than students who were not in a FIG.
FIG research and reports
- Helping Students FIG-ure It Out: A data-driven look at freshmen seminars via first-year interest groups (FIGs)
- Authors: Lovenoor Aulck, Joshua Malters, Casey Lee, Gianni Mancinelli, Alex Lau, Min Sun, Jevin West
- Publication date 2018/2/18
- Predicting student dropout in higher education
- Authors: Lovenoor Aulck, Nishant Velagapudi, Joshua Blumenstock, Jevin West
- Publication date 2016/6/20
- 2009 Freshman Interest Group Assessment Report
- Authors: C. Beyer, J. Peterson, N. Lowell and A. Giesbrecht
- Publication date, 10-05, 2010. (4,700K PDF)
- FYP Response
Learning communities for first-year (freshman & transfer) students
“It was a such a friendly way to start my college life.”
—2016 FIG Student
FIGs are centered around GEN ST 199, a two-credit seminar taught by an upperclass student called a FIG Leader. Students can pick from a variety of FIGs that may or may not include 2–3 other courses. Students find FIGs valuable in making friends and learning about campus resources.
In 2016, 155 FIGs were offered, enrolling 48% of the freshman class (3,104 students).
GEN ST 199 COURSE ASSIGNMENTS


Mapping Your UW Experience
Identify potential majors, plan course sequences for them, attend a related campus activity, write and reflect.
Projecting Forward
Connect with a UW alumnus or other individual who is currently working or has worked in a career you want to learn more about.
CoRe: Seattle Communities and Research
Explore a Seattle neighborhood and use UW Library resources to research issues of population health that affect residents in the area. Topics may include: affordable housing, business and industry, development and changing demographics, homelessness and homeless encampments, minority/ethnic populations and their culture, public art, public parks and green spaces, transportation and urban planning.

Second-year re-enrollment rates
Non-FIGs: 90.9%
FIGs: 94.1%
Six-year graduation rates
Non-FIGs: 75%
FIGs: 81.5%
Pending publishing. L Aulck, J Mathers, C Lee, G Mancinelli, A Lau, M Sun, J West. Target journal: AERA Open.
“Having to complete these projects gave me a more concrete sense of what I want to accomplish in the coming few years.”
—2016 FIG Student
In its 30-year history, the FIG program has enrolled over 70,000 students

90% of students say their FIG leader is “open and approachable,” “provided useful guidance,” and “knew a lot about the UW.”
—2016 FIG Student Experience Summary
FIG Leaders take a 10-week training course prior to teaching their GEN ST 199 course where they design twelve unique lesson plans. Topics include time management, finances, academic preparation, diversity and inclusion, library resources and health and wellness.
FIG Leaders are upperclass students who have a passion for supporting the transition of first-year students.
FIG leaders have a wide variety of majors, representing nine different colleges/schools on campus, with the most popular majors being Biology, Business Administration, Communication, Informatics and Public Health.

“I loved being able to help students adapt to their first year at UW in the best way possible.” —2017 FIG Leader
Students who enroll in a FIG return for their second year and graduate at higher rates than other students
Pending publishing, L. Aulck, J. Mathers, C. Lee, G. Mancinelli, A. Lau, M. Sun, J. West. Target journal: AERA Open.
While FIG enrollment significantly increased the re-enrollment and graduation percentages for all under-represented students, the highest gains were seen among Hispanic students with a nearly 6% increase in second year re-enrollment and a 8% increase in graduation rates.

“I enjoyed seeing familiar faces in my 400-person lectures.” —2016 FIG Student


